Home
2024
Election Results
Election Info
Weblog
Forum
Wiki
Search
Email
Login
Site Info
Store
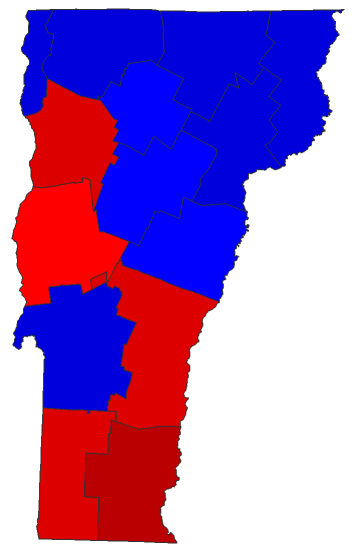
2014 Gubernatorial General Election - Vermont
Note: The Google advertisement links below may advocate political positions that this site does not endorse.
Choose Office
US Representative
Official Results
Choose State
Alabama
Alaska
Arizona
Arkansas
California
Colorado
Connecticut
Florida
Georgia
Hawaii
Idaho
Illinois
Iowa
Kansas
Maine
Maryland
Massachusetts
Michigan
Minnesota
Nebraska
Nevada
New Hampshire
New Mexico
New York
Ohio
Oklahoma
Oregon
Pennsylvania
Rhode Island
South Carolina
South Dakota
Tennessee
Texas
Vermont
Wisconsin
Wyoming
Gubernatorial
Candidate
Political
Party
Popular Vote
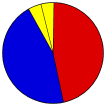
Peter Shumlin
Democratic
89,509
46.36%
Scott Milne
Republican
87,075
45.10%
Dan Feliciano
Libertarian
8,428
4.36%
Emily Peyton
Independent
3,157
1.64%
Pete Diamondstone
Liberty Union
1,673
0.87%
Bernard Peters
Independent
1,434
0.74%
Chris Ericson
Independent
1,089
0.56%
Write-ins
-
722
0.37%
Total Vote
193,087
Maps
(Note: click the 'H' buttons above to hold the given map and change the image map)
Per
Democratic
Republican
Pie
>20%
0
0
>30%
0
0
>40%
27
27
>50%
46
46
>60%
17
17
>70%
3
3
>80%
1
1
>90%
0
0
Election Data and Statistics:
County Data (Table)
(m)
County Data (Graphs)
City and Town Data
(m)
Voter Registration & Turnout Data
(m)
Purchase Detailed Data
Compare State Data by Year (Table)
Compare State Data by Year (Graphs)
View All 2014 Vermont Data
Compare State Maps by Year
View All 2014 Vermont Maps
Data Sources:
Source for Popular Vote data: Vermont Office of the Secretary of State Elections Division, "For Governor,"
Official Report of the Canvassing Committee United States and Vermont Statewide Offices General Election, November 4, 2014
(Rutland, 2014)
< 2012
Choose Year
2022
2020
2018
2016
2012
2010
2016 >
Classic Vermont Results for 2014
-
National Results for 2014
Login
Terms of Use
-
DCMA Policy
-
Privacy Policy and Cookies
©
Dave Leip's Atlas of U.S. Elections, LLC 2019 All Rights Reserved