Note: The Google advertisement links below may advocate political positions that this site does not endorse.
Official Results
  Presidential
Candidate
Vice Presidential
Candidate
Political
Party
Popular VoteElectoral Vote
Barack H. ObamaJoseph R. Biden, Jr.Democratic 905,109 58.06%7
Willard Mitt RomneyPaul RyanRepublican 634,899 40.72%0
Gary JohnsonJames P. GrayLibertarian 12,580 0.81%0
Ross C. 'Rocky' AndersonLuis J. RodriguezIndependent 5,487 0.35%0
YOther (+) - - 918 0.06%0
Total Vote 1,558,993
Maps
2012 Presidential General Election - Connecticut Election County Map
County H
County Pop H
2008 Button H
Per Vote Democratic Button H
Per Vote Republican Button H
Swing Map Button H
Trend Map Button H
Town H
Last Button H
Per Vote Democratic Button H
Per Vote Republican Button H
Swing Map Button H
Trend Map Button H
County H
 
(Note: click the 'H' buttons above to hold the given map and change the image map)
PerDemocraticRepublicanPie
>20%
 
0
 
 
0
 
pie
>30%
 
0
 
 
0
 
>40%
 
8
 
 
8
 
>50%
 
78
 
 
78
 
>60%
 
17
 
 
17
 
>70%
 
9
 
 
9
 
>80%
 
3
 
 
3
 
>90%
 
1
 
 
1
 
 Election Data and Statistics:
Data Sources:
  • Source for Popular Vote data: Connecticut Secretary of the State Election Services Division. Statement of Vote Presidential Electors For, Connecticut Secretary of the State Election Services Division (http://www.statementofvote-sots.ct.gov/StatementOfVote/WebModules/ReportsLink/OfficeTitle.aspx ) (accessed 02 Dec 2012)
Election Notes:
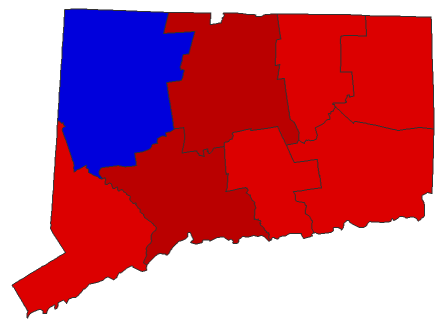
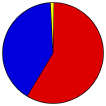
  • Official Results list Obama as receiving 905,083 votes and Romney 634,892. Corrected figures in Waterbury (New Haven County) per Town Clerk


Classic Connecticut Results for 2012 - National Results for 2012

Login

Terms of Use - DCMA Policy - Privacy Policy and Cookies


© Dave Leip's Atlas of U.S. Elections, LLC 2019 All Rights Reserved