Note: The Google advertisement links below may advocate political positions that this site does not endorse.
| Map | Pie | Office | Total | D | R | I | Margin | %Margin | Dem | Rep | Ind | Oth. | Dem | Rep | Ind | Other | | | | | | | | | | | | | | | | | | |
|---|
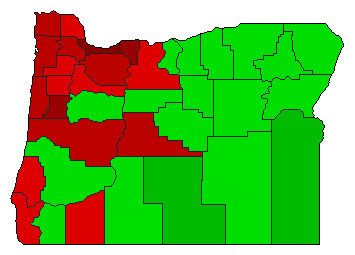
 |  | Governor |
1,866,997 |
1 |
2 |
3 |
119,510 |
6.40% |
50.05% |
43.65% |
2.86% |
3.43% |
934,498 |
814,988 |
53,392 |
64,119 |
| | | Map | Pie | Initiative | Total Vote | N | | Y | Margin | %Margin | No | | Yes | Oth. | No | | Yes | |
 |  | Initiative |
1,854,511 |
1 |
0 |
2 |
536,925 |
28.95% |
64.48% |
0.00% |
35.52% |
0.00% |
1,195,718 |
0 |
658,793 |
0 |
|
