| |
Presidential
Candidate | Home State | Political
Party | Primary Vote | Delegates |
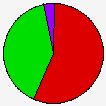
 | Hillary Clinton | New York | Democratic |
705,185 |
56.01% | 55 | 45.5% |
 | Barack Obama | Illinois | Democratic |
511,680 |
40.64% | 38 | 31.4% |
 | John Edwards | North Carolina | Democratic |
20,101 |
1.60% | 0 | 0.0% |
| Uncommitted | - | Democratic |
8,041 |
0.64% | 0 | 0.0% |
| Write-ins | - | Democratic |
3,279 |
0.26% | 0 | 0.0% |
| Joe Biden | Delaware | Democratic |
3,216 |
0.26% | 0 | 0.0% |
| Dennis J. Kucinich | Ohio | Democratic |
2,992 |
0.24% | 0 | 0.0% |
| Bill Richardson | New Mexico | Democratic |
1,846 |
0.15% | 0 | 0.0% |
| Mike Gravel | Virginia | Democratic |
1,463 |
0.12% | 0 | 0.0% |
| Chris Dodd | Connecticut | Democratic |
1,120 |
0.09% | 0 | 0.0% |
 | Unallocated | - | Democratic |
- |
- | 28 | 23.1% |
 |
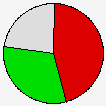
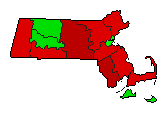
Map Key
| Turnout
 |  |  |
|
|
| | Election Information: | | Contest Type: | State-run Primary | | Election Date: | 2008-02-05 | | Eligible Participants: | Modified Open (members of the party or independents) | | Delegates Awarded in this Contest: | 93 | | Delegates Total: | 121 | | Delegate Allocation Method: Proportional - the candidates are awarded delegates in proportion to the percentage of votes received. A 15% threshold is required to receive delegates. |
- 32 at-large delegates
- 61 district delegates
- 26 unpledged delegates
- 5 delegates from CD 5
- 6 delegates from CDs 1, 2, 3, 6, 7, 8, 9
- 7 delegates from CDs 4, 10
|
|
| Demographic Data
| 2010 Population: | 6,547,629 | Enum. | 2010 Population Density: | 322.4 | persons/km2 | | 2008 Population: | 6,468,967 | Est. | 2008 Population Density: | 318.6 | persons/km2 | | 2000 Population: | 6,349,097 | Enum. | 2000 Population Density: | 312.7 | persons/km2 | | Total Delegates: | 121.0 | | Delegates Density: | 53,463 | persons/Del | | Land Area (2000): | 20,306 | km2 | Annual Pop Growth Rate: | 0.3 | % |
| Election Data and Statistics:
| Election Tools
|
| |


