Home
2024
Election Results
Election Info
Weblog
Forum
Wiki
Search
Email
Login
Site Info
Store
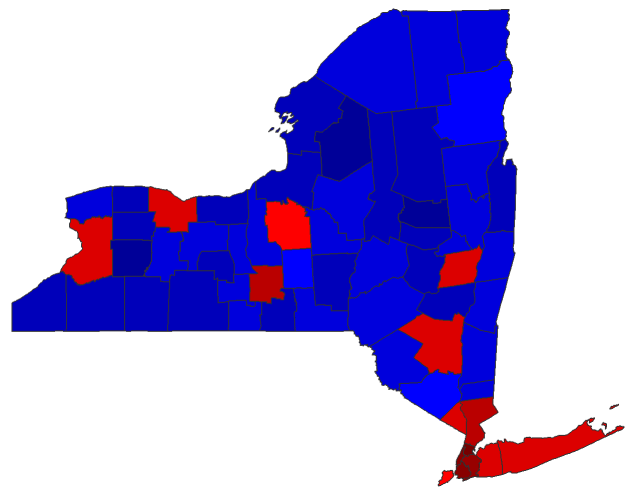
2018 Gubernatorial General Election - New York
Note: The Google advertisement links below may advocate political positions that this site does not endorse.
Choose Office
Senator Class 1
Official Results
Choose State
Alabama
Alaska
Arizona
Arkansas
California
Colorado
Connecticut
Florida
Georgia
Hawaii
Idaho
Illinois
Iowa
Kansas
Maine
Maryland
Massachusetts
Michigan
Minnesota
Nebraska
Nevada
New Hampshire
New Mexico
New York
Ohio
Oklahoma
Oregon
Pennsylvania
Rhode Island
South Carolina
South Dakota
Tennessee
Texas
Vermont
Wisconsin
Wyoming
Gubernatorial
Candidate
Lt. Gubernatorial
Candidate
Political
Party
Popular Vote
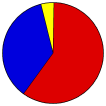
Andrew M. Cuomo
Kathy C. Hochul
Democratic
3,635,340
59.55%
Marc Molinaro
Julie Killian
Republican
2,207,602
36.16%
Howie Hawkins
Jia Lee
Green
103,946
1.70%
Larry Sharpe
Andrew C. Hollister
Libertarian
95,033
1.56%
Stephanie A. Miner
Michael J. Volpe
Serve America Movement
55,441
0.91%
Write-ins
-
-
7,115
0.12%
Total Vote
6,104,477
Maps
(Note: click the 'H' buttons above to hold the given map and change the image map)
Per
Democratic
Republican
Pie
>20%
>30%
>40%
>50%
>60%
>70%
>80%
>90%
Election Data and Statistics:
County Data (Table)
(m)
County Data (Graphs)
Voter Registration & Turnout Data
(m)
Purchase Detailed Data
Compare State Data by Year (Table)
Compare State Data by Year (Graphs)
View All 2018 New York Data
Compare State Maps by Year
View All 2018 New York Maps
Data Sources:
Source for Popular Vote data: New York State Board of Elections,
Certified Results from the November 6, 2018 General Election for Governor and Lt. Governor
(Albany, 2018)
< 2014
Choose Year
2022
2014
2010
2022 >
Classic New York Results for 2018
-
National Results for 2018
Login
Terms of Use
-
DCMA Policy
-
Privacy Policy and Cookies
©
Dave Leip's Atlas of U.S. Elections, LLC 2019 All Rights Reserved